> ## Documentation Index
> Fetch the complete documentation index at: https://moridb.sh/docs/llms.txt
> Use this file to discover all available pages before exploring further.
# TUI Dashboard
> Real-time terminal dashboard for monitoring Mori proxy activity.
## Overview
Mori includes a terminal UI dashboard built with BubbleTea. Launch it with:
```bash theme={null}
mori dash
```
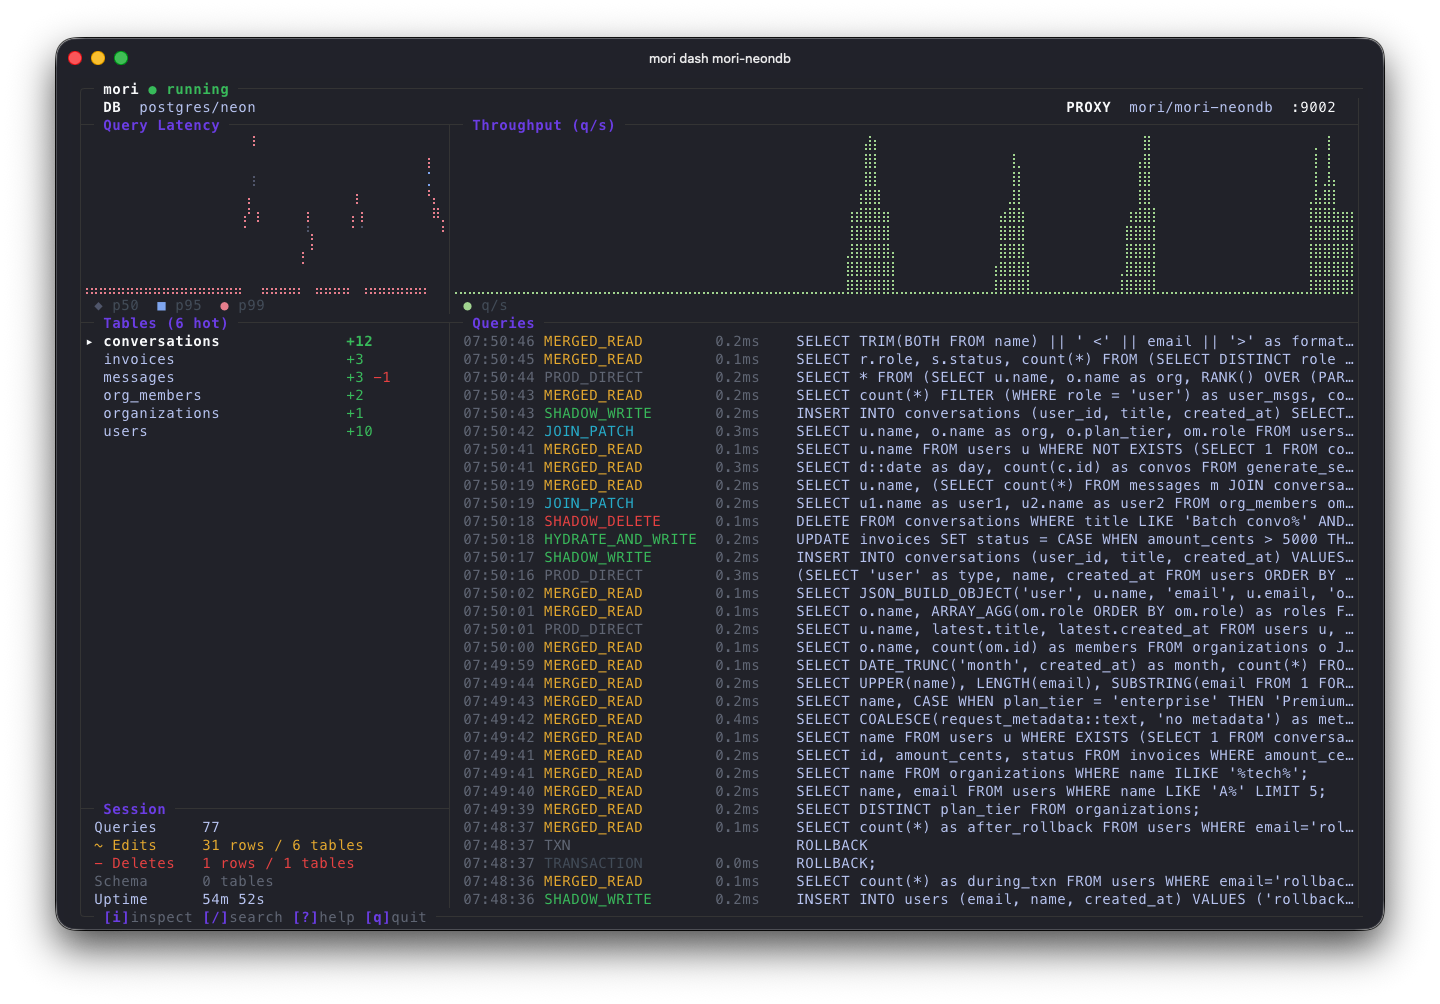
The dashboard provides real-time visibility into proxy activity, delta/tombstone state, and query routing.
 ## Dashboard Layout
The TUI is organized into panels:
* **Top Bar** — Connection info, engine type, proxy port, session duration
* **Latency Chart** — Real-time query latency visualization
* **Throughput Chart** — Queries per second over time
* **Tables Panel** — List of affected tables with delta counts, tombstone counts, and schema divergence indicators
* **Query Stream** — Live feed of queries with classification, routing strategy, and timing
* **Session Summary** — Aggregate stats (total queries, reads, writes, deltas, tombstones)
* **Bottom Bar** — Keybinding hints and help
## Keybindings
| Key | Action |
| --------- | ------------------------------------------------------------- |
| `j` / `k` | Navigate up/down in lists |
| `Enter` | Select / drill into table |
| `i` | Inspect selected table (detailed delta/tombstone/schema view) |
| `/` | Search / filter queries |
| `?` | Toggle help screen |
| `Esc` | Back / close panel |
| `q` | Quit dashboard |
## Features
* **Real-time query stream** — Every query that passes through the proxy appears in the stream with its classification (READ/WRITE/DDL), routing strategy (Prod Direct, Merged Read, Shadow Write, etc.), and execution time.
* **Table inspection** — Select a table to see its delta count, tombstone count, schema divergence (added/dropped/renamed columns), and PK type.
* **Search filtering** — Filter the query stream by table name, operation type, or SQL text.
* **Live charts** — Latency and throughput charts update in real-time as queries flow through the proxy.
The TUI reads state from the same `.mori/` directory as the proxy. It can be launched while the proxy is running to monitor activity, or after the proxy stops to inspect final state.
## Dashboard Layout
The TUI is organized into panels:
* **Top Bar** — Connection info, engine type, proxy port, session duration
* **Latency Chart** — Real-time query latency visualization
* **Throughput Chart** — Queries per second over time
* **Tables Panel** — List of affected tables with delta counts, tombstone counts, and schema divergence indicators
* **Query Stream** — Live feed of queries with classification, routing strategy, and timing
* **Session Summary** — Aggregate stats (total queries, reads, writes, deltas, tombstones)
* **Bottom Bar** — Keybinding hints and help
## Keybindings
| Key | Action |
| --------- | ------------------------------------------------------------- |
| `j` / `k` | Navigate up/down in lists |
| `Enter` | Select / drill into table |
| `i` | Inspect selected table (detailed delta/tombstone/schema view) |
| `/` | Search / filter queries |
| `?` | Toggle help screen |
| `Esc` | Back / close panel |
| `q` | Quit dashboard |
## Features
* **Real-time query stream** — Every query that passes through the proxy appears in the stream with its classification (READ/WRITE/DDL), routing strategy (Prod Direct, Merged Read, Shadow Write, etc.), and execution time.
* **Table inspection** — Select a table to see its delta count, tombstone count, schema divergence (added/dropped/renamed columns), and PK type.
* **Search filtering** — Filter the query stream by table name, operation type, or SQL text.
* **Live charts** — Latency and throughput charts update in real-time as queries flow through the proxy.
The TUI reads state from the same `.mori/` directory as the proxy. It can be launched while the proxy is running to monitor activity, or after the proxy stops to inspect final state.